PLOTTING FUNCTION GRAPH USING JAVASCRIPT (Part 1)
Note: Please wait a bit for the math formulas to appear.(I use MathJax.js)
Let consider a spring-mass system with the mass sliding on a horizontal surface. The force of dry friction between the mass and the surface is called Coulomb friction. \[F_{cl} = \mu.m.g\] $\mu$ is the coefficient of friction.
The half period (0.5*T) is the time for the mass to move in one direction from rightmost position to leftmost position or vice versa from extreme left to extreme right.
The period T is the time for the mass to move from the rightmost position to the left and then moving back to the new rightmost position.
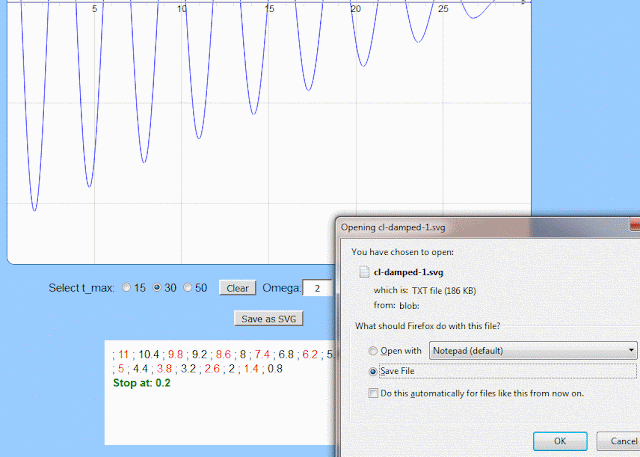
We can prove that: \[T = \frac{2\pi}{\omega}\quad\text{and}\quad\omega=\sqrt{\frac{k}{m}}\] The minimum stretch d of spring for oscillation to start ($x_0 > d$): \[k.d = F_{cl}=\mu.m.g\quad\to\quad d = \frac{F_{cl}}{k}\] We can prove that: The loss of amplitude in half period is \[2.d = 2.\frac{\mu.m.g}{k}\] The following is the JPG picture of my web page "sin-small-15.html"
At the top of the page is the oscillating graph of the spring-mass system with
an angular frequency of 2 (rad/s), d = 0.3 (cm)
and when t = 0: x0 = 11 cm (v0 = 0)
To plot a new graph you need to act as the below:
- Click the button "Clear"
- Enter new values for "Omega","x_0" and "d"
- Click the button "Show"


DOWMLOAD 4 files (html, tex, pdf graph, svg graph) - 68 KB
http://www.mediafire.com/file/9ax3q4ufgpiq7ta/damped-oscillation-15.zip

Let consider a spring-mass system with the mass sliding on a horizontal surface. The force of dry friction between the mass and the surface is called Coulomb friction. \[F_{cl} = \mu.m.g\] $\mu$ is the coefficient of friction.
The half period (0.5*T) is the time for the mass to move in one direction from rightmost position to leftmost position or vice versa from extreme left to extreme right.
The period T is the time for the mass to move from the rightmost position to the left and then moving back to the new rightmost position.
We can prove that: \[T = \frac{2\pi}{\omega}\quad\text{and}\quad\omega=\sqrt{\frac{k}{m}}\] The minimum stretch d of spring for oscillation to start ($x_0 > d$): \[k.d = F_{cl}=\mu.m.g\quad\to\quad d = \frac{F_{cl}}{k}\] We can prove that: The loss of amplitude in half period is \[2.d = 2.\frac{\mu.m.g}{k}\] The following is the JPG picture of my web page "sin-small-15.html"
At the top of the page is the oscillating graph of the spring-mass system with
an angular frequency of 2 (rad/s), d = 0.3 (cm)
and when t = 0: x0 = 11 cm (v0 = 0)
To plot a new graph you need to act as the below:
- Click the button "Clear"
- Enter new values for "Omega","x_0" and "d"
- Click the button "Show"


4- HTML and JavaScript Source code
<!DOCTYPE HTML> <html> <head> <meta http-equiv="content-type" content="text/html; charset=utf-8"> <title>Coulomb OSC</title> <head> <style> body{ font-family:'Arial'; font-size:11pt; margin:0px; padding:0px; background-color:#99CCFF; } input[type=text]{background-color:white; text-align:center} button{background-color:#DDDDDD} </style> <link rel="stylesheet" type="text/css" href="http://jsxgraph.uni-bayreuth.de/distrib/jsxgraph.css" /> <style> </style> <script type="text/javascript" src="http://jsxgraph.uni-bayreuth.de/distrib/jsxgraphcore.js"></script> <script src="http://cdn.jsdelivr.net/g/filesaver.js"></script> </head> <body onload="init()"> <div align=center> <h2>COULOMB DAMPED OSCILLATION GRAPH</h2> <h3>1- Plotting graph using javascript</h3> <div id="box" class="jxgbox" style="width:700px; height:700px;"></div> <br> <label for="gender">Select t_max: </label> <input type="radio" name="widthRadio" value="15" onclick="init()">15 <input type="radio" name="widthRadio" value="30" checked onclick="init()">30 <input type="radio" name="widthRadio" value="50" onclick="init()">50 <button onclick="clr()">Clear</button> Omega:<input type=text id="omega" size=3 value=2> x_0:<input type=text id="x0" size=4 value=11> d:<input type=text id="d" size=4 value=0.3> <button onclick="show()">Show</button> <br><br> <button onclick="saveSVG()">Save as SVG</button> <br><br> <div id="div1" style="width:420px;height:120px;padding:10px;text-align:left;overflow:auto;background-color:white"> </div> <br> </div> <script> wid = 30; function init(){ var radios = document.getElementsByName('widthRadio'); for (var i = 0, length = radios.length; i < length; i++){ if (radios[i].checked){ wid = radios[i].value; break; } } brd1 = JXG.JSXGraph.initBoard('box', {boundingbox: [0, 13, wid, -13], axis:true}); } Pi = Math.PI; nn = 2000; var f var brd1 = JXG.JSXGraph.initBoard('box', {boundingbox: [0, 13, wid, -13], axis:true}); function show(){ w = Number(document.getElementById('omega').value); x0 = Number(document.getElementById('x0').value); d = Number(document.getElementById('d').value); for(i= 0; i<nn; i++){ if(x0-(2*i+1)*d + d > d ){ mm1 = x0-(2*i+1)*d + d; mm = Math.round(mm1 * 100) / 100; if(i % 2 == 0){mm ='<span style="color:red">'+ mm + '</span>'} if((i+1) % 10 == 0 ){mm = mm + '<br>'} st = document.getElementById('div1').innerHTML; document.getElementById('div1').innerHTML = st + ' ; ' + mm; f = brd1.createElement('functiongraph', [function(x){ if(x>i*Pi/w && x <(i+1)*Pi/w){ return (x0-(2*i+1)*d)*Math.cos(w*x) + Math.pow(-1,i)*d; }else{ return 0 // break; } }]); } else{ mm2 = (x0-(2*i+1)*d)*Math.cos(Pi*(i+2)) + Math.pow(-1,i)*d; mm3 = Math.round(mm2 * 100) / 100; st = document.getElementById('div1').innerHTML; document.getElementById('div1').innerHTML = st + '<br><span style="color:green"><b>Stop at: ' + mm3+'</b></span>'; break } } var xr = brd1.create('line',[[0,0],[10,0]],{visible:true, strokeColor: "#CCCCCC"}); } function saveSVG(){ var svg = new XMLSerializer().serializeToString(brd1.renderer.svgRoot); // alert(svg); var blob = new Blob([svg], {type: "text/plain;charset=utf-8"}); saveAs(blob, "cl-damped-1.svg"); } function clr(){ brd1 = JXG.JSXGraph.initBoard('box', {boundingbox: [0, 13, wid, -13], axis:true}); document.getElementById('div1').innerHTML = ''; } </script> </body> </html>


DOWMLOAD 4 files (html, tex, pdf graph, svg graph) - 68 KB
http://www.mediafire.com/file/9ax3q4ufgpiq7ta/damped-oscillation-15.zip


